Guess The Plot #2
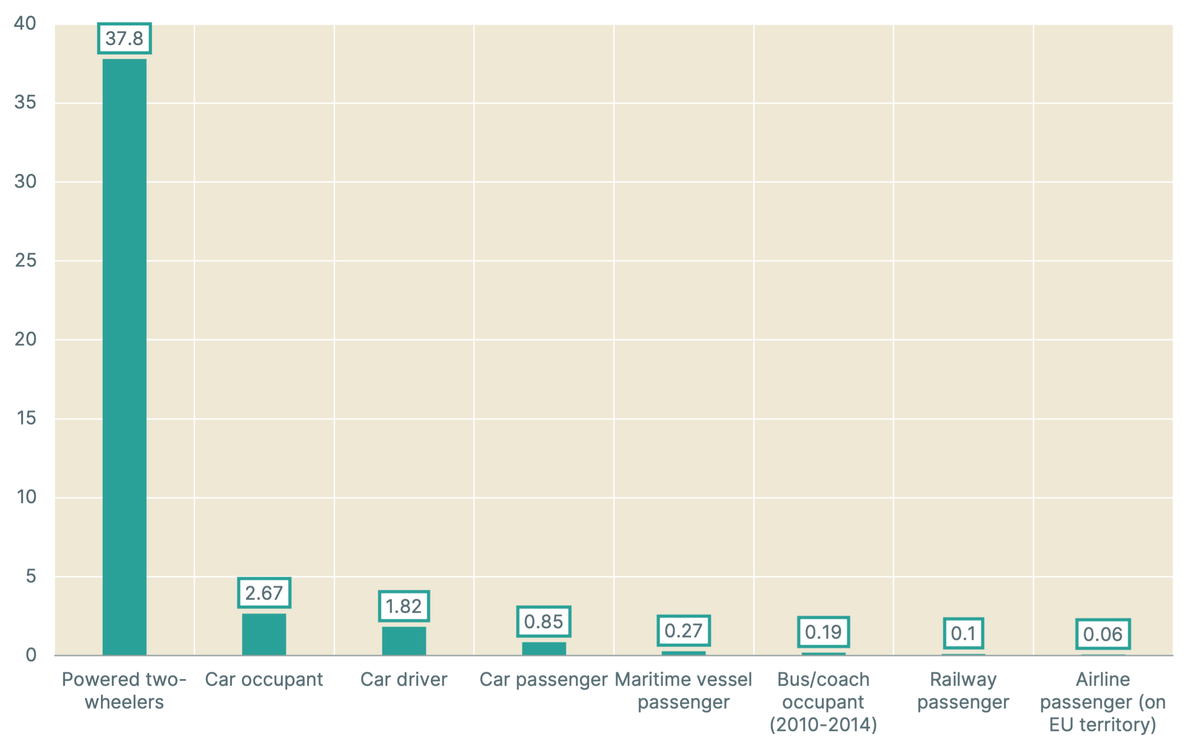
Can you identify the data represented on the plot?
Answer
The plot represents the risk of transportation modes in the European Union, measured in fatalities per billion passenger-kilometers (in the EU-27, during 2011-2015).
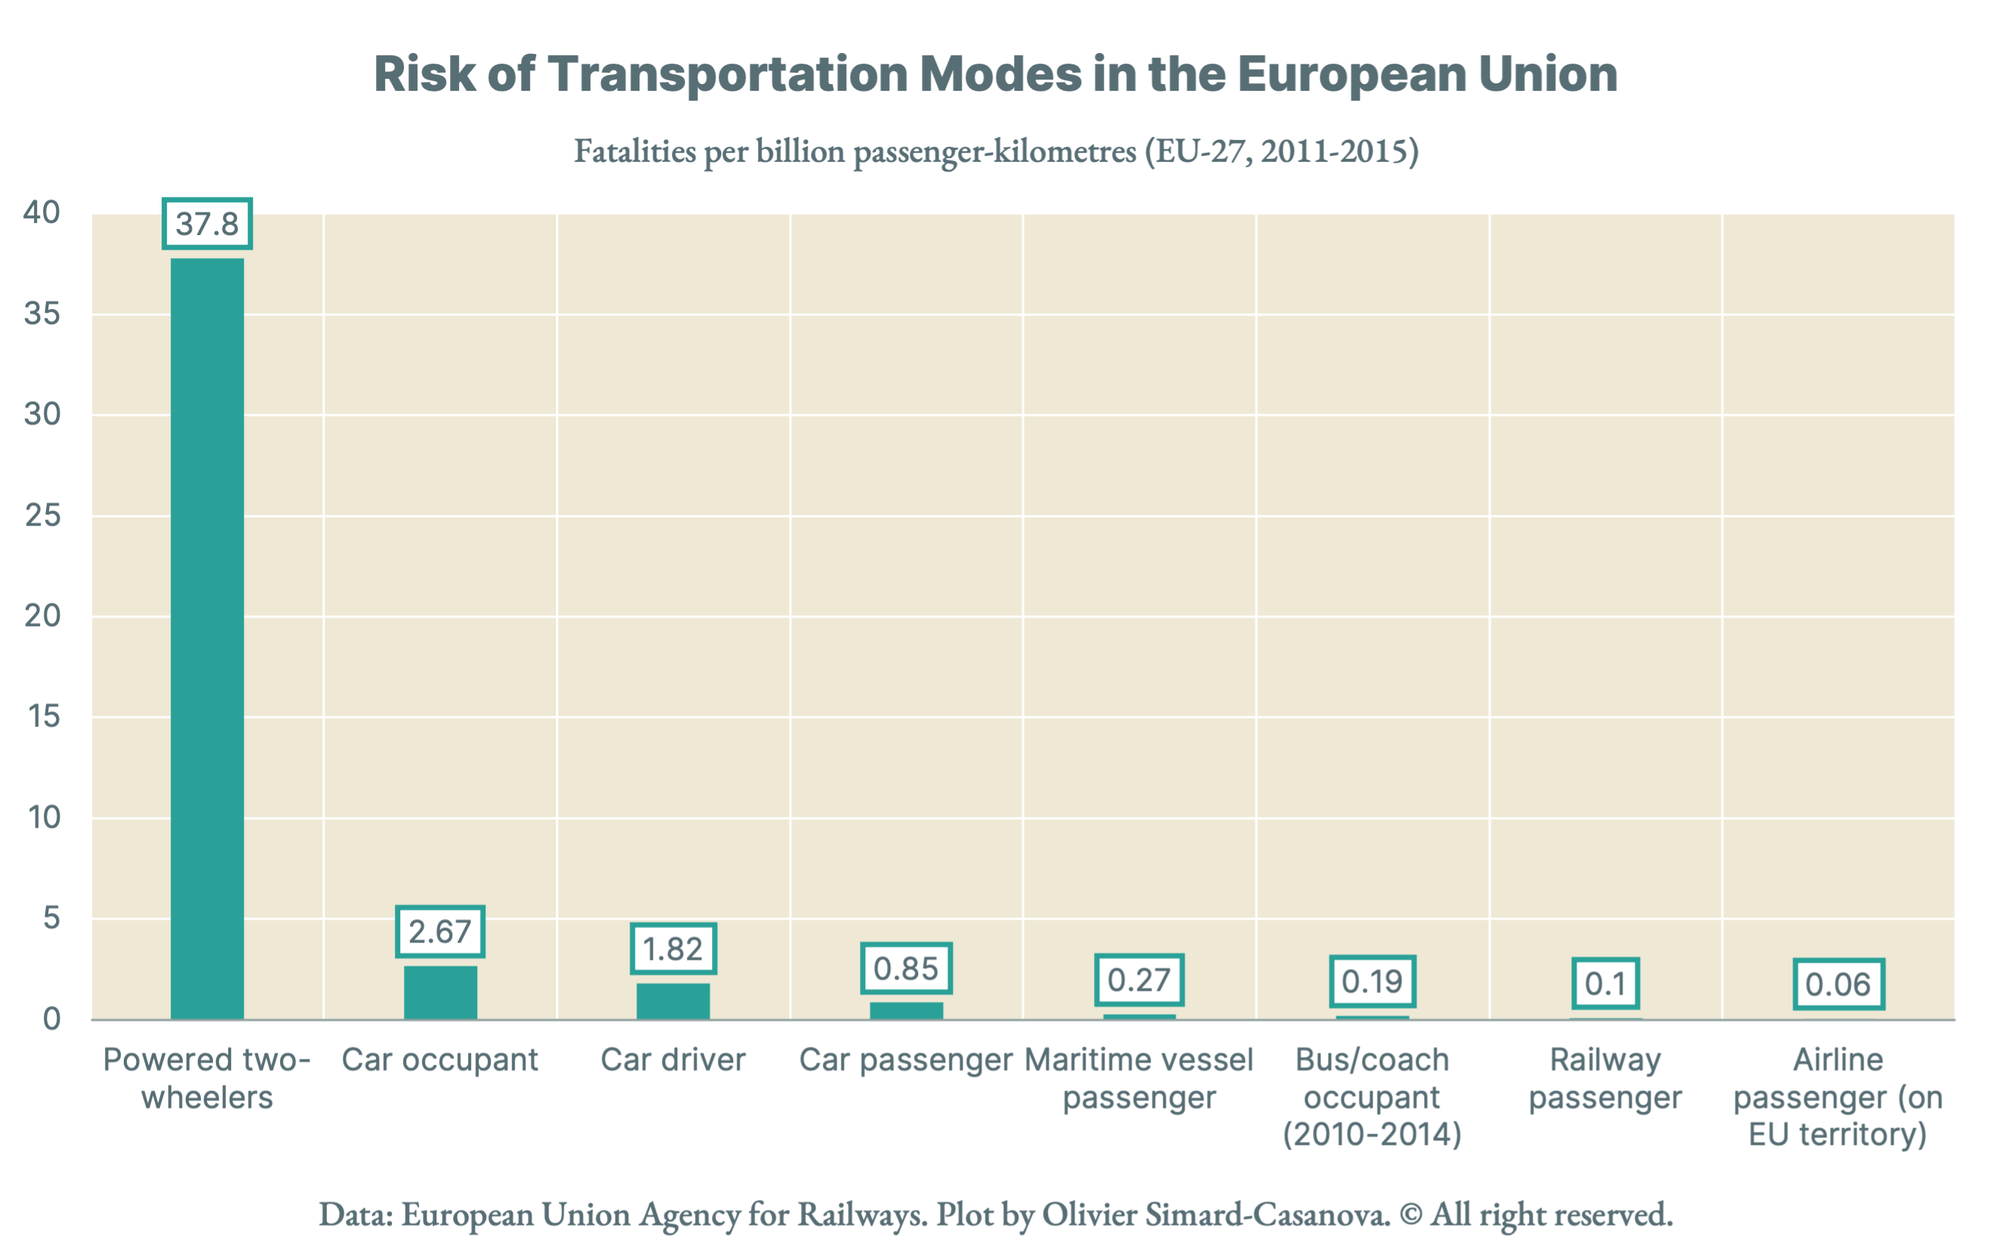
Can you identify the data represented on the plot?
The plot represents the risk of transportation modes in the European Union, measured in fatalities per billion passenger-kilometers (in the EU-27, during 2011-2015).
Matt Navarra on Threads, citing a Business Insider article, reports that in the United States, Threads already has more daily users than X, formerly Twitter. In April 2024, Threads has 28 million daily active users, X has 22 million. Threads has 100 million monthly active users, X has 140 million.
Carbon Brief has published a comprehensive article containing multiple visualizations of global temperature data. The visualizations show that 2024 has already broken multiple temperature records. As shown in Figure 1, the first four months of 2024 have seen the largest temperature anomaly since the 1940s. The temperature anomaly is the
Figure 1 is an interesting plot shared on Bluesky by Jacob T. Levy. It shows the cumulative total of funds raised by the campaigns of Donald Trump (in red) and Joe Biden (in blue), in 2020 (dotted line) and 2024 (solid line), between 600 days before Election Day and Election
As a reminder, Threads is Meta's Instagram-backed Twitter competitor. According to Digiday, Meta has been promoting Threads' upcoming advertising features to a selection of executives working in the advertising industry. The advertising features would arrive in the second half of 2024, a bit more than a year