🚀 R: Use a Brewer color scale in a ggplot2 plot – Snippet #61
Discover how to use a Brewer color scale in a ggplot2 plot with R
Discover how to use a Brewer color scale in a ggplot2 plot with R
Discover how to restyle a folder icon with an emoji in the bookmark bar with Safari
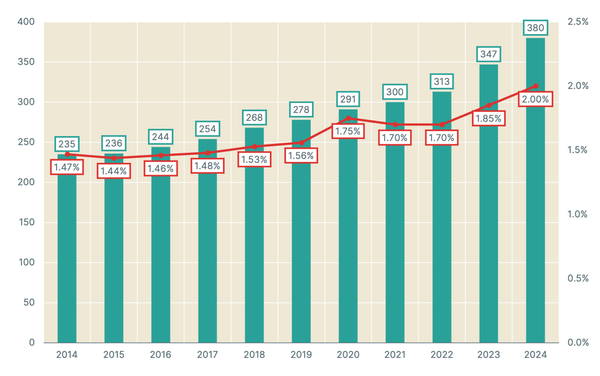
Can you identify the data represented on the plot?
Discover how to uninstall orphaned packages with Homebrew

Discover what a dependency is in programming